
Overview on Portfolio Management
- Nov 26, 2021
- 7 min read
Updated: Apr 30, 2024

This post may contain affiliate links, which means I may receive a small commission, at no cost to you, if you make a purchase through a link
Portfolio management is a useful strategy for business objectives. Below, the different phases of portfolio management are elaborated on. However, the focus lies on asset allocation. An in-depth explanation of the Modern Portfolio Theory is provided.
Planning step
Active VS passive investors
There are two types of investment styles:
· Passive investors
Passive investors follow the efficient market hypothesis. So, share prices reflect all available information. Therefore, they believe that in the long run, it’s impossible to beat the market.
· Active investors
Active investors are more related to portfolio management. They believe they can outperform the market by selecting an optimal portfolio. However, to be profitable, the return needs to be high enough to cover all costs involved.
The Investment policy statement
For portfolio planning, strategies should be studied to construct a proper portfolio. The investor policy statement is a written document drafted by portfolio managers. It outlines and understands the investors’ features and expectations. Therefore, it contains:
- The overall investment objective;
- The return, distribution, and risk requirements;
- Risk tolerance of the investor
- Relative constraints
- Other considerations relevant to the investment strategy
Risk aversion
Risk aversion is the tendency to prefer low-uncertainty settings over high-uncertainty ones:
· Very risk-averse investors choose to safeguard the liquidity of their investments. Due to this, their portfolios do not contain volatile assets. Examples are government bonds, certificates of deposits, and treasury securities.
· Risk-neutral investors do not take risk into account. So, their decision is based only on potential gains.
· Less-risk-averse investors are willing to take on more risk for higher rewards.
Execution step
The chapter begins with a brief overview of some elements essential to understand portfolio theory.
Standard deviation as measure of risk
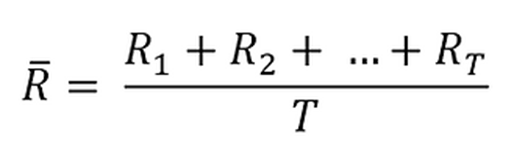
Standard deviation is a measure of how much an investment's returns can vary from its average return. The average return can be computed:
· arithmetically as the mean return:
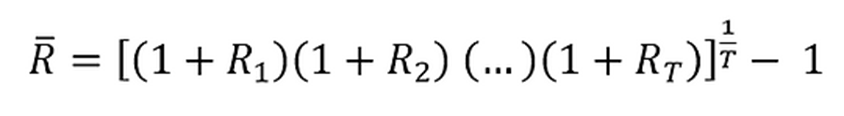
· geometrically using the formula of the holding period return:
Standard deviation measures the dispersion of data concerning the average return. A high value deviates from the average, meaning increased uncertainty and risk.
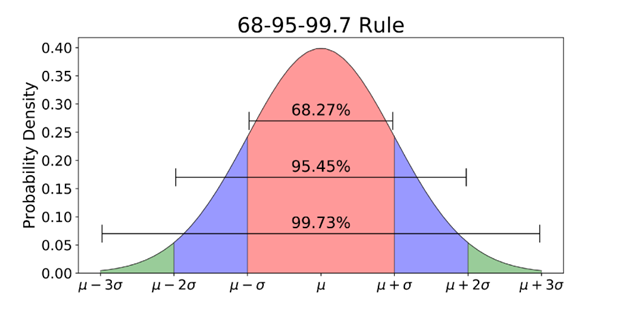
According to the figure, there is a 99,73% probability of the return falling in the range. So, a lower standard deviation decreases the range and lowers uncertainty and the possibility of loss.
Diversification
Diversification is a way to reduce the risk of a portfolio. The core idea is that assets move in different directions. Therefore, getting similar assets increases risk. Instead, with different assets, a bad performance will be made up for by another asset.
Covariance and correlation
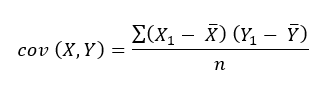
The indicator used to express this concept is covariance. It measures the relationship between two random variables. Also, it evaluates to what extent the variables change together:
Positive covariance: Indicates that two variables tend to move in the same direction
Negative covariance: Indicates that two variables tend to move in inverse directions

The following formula determines the degree of strength in the relationship:


in case of correlation being less than 1, diversification can reduce the risk of the portfolio. At 1, the risk of a portfolio with two assets is similar to the sum of the risk of holding separate assets. In all other cases, a portfolio is less risky as returns and losses offset each other.
The Markowitz model
The Markowitz model is a portfolio optimization model. It holds the idea that a rational investor:
· When given two portfolios with equal risk, would prefer the one with higher return.
· When given two portfolios with equal return, would prefer the one with lower risk.
So, instead of choosing between these two options, we can combine both and seek to minimize this equation:

· "x" is the proportion of money invested in each asset, where the sum of all x is 1.
· "Lambda" is the risk-return preference level.
The aim is to solve optimum x* vector through various values of lambda. Then, the expected return and standard deviation values can be computed. Afterward, the true efficient frontier can be drawn to suggest the most efficient portfolio.


The Modern Portfolio Theory
According to this theory, investors should select a portfolio from the efficient set, depending on their risk appetite. MPT lies in two strong assumptions. Firstly, markets are efficient. Secondly, the correlation between assets is fixed, whereas it is not constant in the real world.
Asset allocation
Asset allocation deals with finding the proper combination between the risky portfolio and the risk-free assets. When adding a risk-free asset to the risky portfolio, the risk is reduced. This is because the low volatility reduces the variance of the portfolio. Investors can decide the risk and risk-free proportion by moving along the Capital allocation line. In general, the portfolio that respects the tangency condition with one of the capital allocation lines is the optimal risky portfolio. The line is called the Capital market line.
Security selection This part of the selection of stock forms the portfolio. A fundamental analysis is made of the security sector. Indicators such as price-earnings, price-book, price-cash flow, and revenue and earnings growth are used. These can be found in the Exchange Traded Fund (ETF). Furthermore, it’s important to evaluate the risk carried by each security. This contributes to the risk of the portfolio. Also, it can be evaluated if it is systematic or unsystematic.
Idiosyncratic/unsystematic risk
This is the risk specific to each asset. It’s a company-specific risk and depends on factors like new competitors or the launching of new products. Unsystematic risk is foreseeable and can be offset by diversification.
Systematic risk
Risk common for the entire market. The cause factors are beyond the control of the company or individual. So, it is external to the organization. Since all assets carry the risk, it is non-diversifiable. There are four types:
· Market risk: the tendency of investors to follow the direction of the market.
· Interest rate risk: changes in the price of a security due to changes in interest rate
· Purchasing power risk: in case of positive inflation, a lack of proportional income growth decreases purchasing power.
· Exchange rate risk: uncertainty associated with changes in the value of foreign currencies
Using diversification investors can reduce the idiosyncratic risk, but not the systematic risk. Therefore, there is a minimum amount of risk that all investors have to bear, intrinsic in the market.

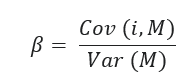
Beta as a measure of systematic risk
Beta is the indicator of systematic risk. It measures the movement of an asset according to the movement of the overall market portfolio. Thus, it is an indicator of volatility. The beta represents the contribution of stock to the non-diversifiable risk to the market portfolio.

The Capital Asset Pricing Model
Investors are willing to take on more risk than the risk-free rate only if they receive a higher level of return. This is called the risk premium. The CAPM formula allows investors to calculate the expected return per risk. Therefore, the Capital Asset Pricing Model describes the relationship between systematic risk and expected return. The latter discounts the expected dividends and capital appreciation of the stock over the expected period.
· The risk-free rate: the time value of money.
· The beta
· The factor is the market risk premium. This is the additional return an investor will receive from holding a risky market portfolio.
The security market line is the graphical representation of the CAPM model. It is an upward-sloping curve, with β as slope and the risk-free rate as intercept. This is the minimum return an investor can obtain, corresponding to 0 risk level.

Evaluating step
Re-balancing
When re-balancing, the allocation of assets in the portfolio is adjusted to the investor’s preference. The value of assets changes over time. Therefore, investors need to regularly re-balance the weights of their investments. Thus, they maintain the desired proportion between risky and risk-free assets. There are two classes of re-balancing:
· Constant mix strategy: the weight of the holdings does not change
1. Calendar re-balancing: adjusting to the original allocation at a desired frequency.
2. Percentage of portfolio re-balancing: every asset has a target and range for its value. The portfolio is re-balanced when an asset jumps outside the range.
Constant proportion portfolio insurance: The assumption that as the value of the portfolio increases, risk tolerance becomes higher. Consequently, a higher percentage will be invested in risky assets.
Conclusion
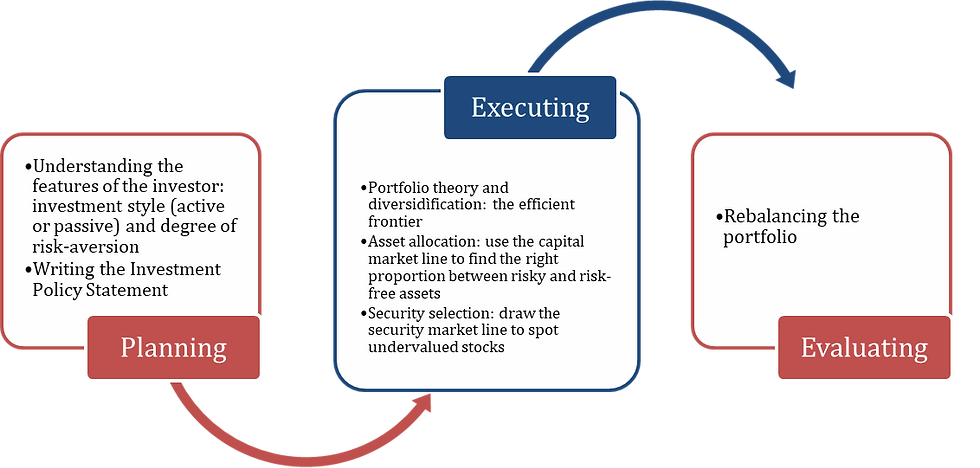
Portfolio management is the building of an optimal portfolio for each active investor. Firstly, targeted risk, risk tolerance, and constrains are determined through the Investment Policy Statement. Secondly, the efficient frontier is found through the portfolio theory. Then, asset allocation is applied. Fourthly, the portfolio manager proceeds with stock selection. However, after building the portfolio, regular modification is still needed. Therefore, re-balancing is an intrinsic part of the process.

Binance offers a diverse range of investment opportunities and tools tailored to both novice and experienced investors, enabling them to build portfolios aligned with their financial objectives and timeframes. Sign up here and receive 100 USDT cashback voucher.
Reference List
Active_Portfolio_Management-with-cover-page-v2.pdf (d1wqtxts1xzle7.cloudfront.net)
DARWIN Filters: A Practical Alternative to Markowitz Portfolio Theory | Darwinex Blog
Modern Portfolio Theory (MPT) - Overview, Diversification (corporatefinanceinstitute.com)
Systemic Risk - Understanding How Systemic Risk Affects the Economy (corporatefinanceinstitute.com)
Beta Definition: Meaning, Formula, & Calculation (investopedia.com)


Comments