Is Bitcoin a Safe Investment in 2026?
Updated: Aug 26
Bitcoin has spent over fifteen years trying to earn the label "digital gold." In 2026, that claim is being stress-tested by three forces at once: a Federal Reserve still unwilling to commit to rate cuts, a US debt load that keeps setting records, and a Middle East conflict that won't fully resolve. None of these are new stories individually. Together, they make this a genuinely difficult year to call Bitcoin either safe or reckless without looking at the numbers first.
Bitcoin Price and On-Chain Data in August 2026
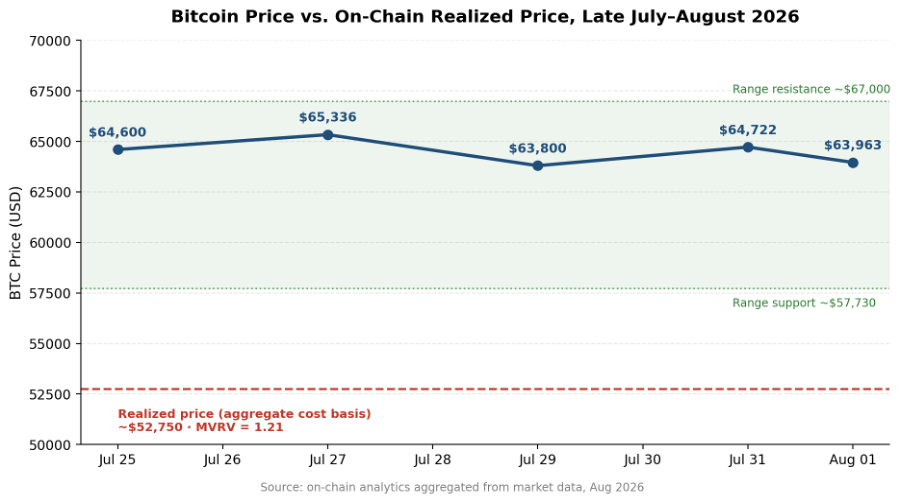
Bitcoin is changing hands near $64,000, sitting roughly 50% below its cycle peak, and the chart itself doesn't offer a clean verdict either way. The weekly moving averages crossed bearish in late July, a setup that's flagged trend deterioration in prior cycles. At the same time, weekly RSI is diverging higher even as price makes lower lows a pattern that often precedes at least a short-term bounce. Two signals, two different conclusions. This is a market where the chart is arguing with itself, and that tension is exactly why the on-chain data below carries more weight than either indicator alone.Price action alone is noise here. On-chain data is where the actual signal lives.
The MVRV ratio market value divided by realized value is currently reading between 1.2 and 1.4, depending on which lookback window you use. Adjust for volatility and the Z-Score version puts it closer to 2.5. Both readings land in the same place: comfortably above the sub-1.0 zone that's marked past capitulation bottoms, but well short of the 3.0+ territory that's typically shown up at cycle tops. Historically, the 1–2 band on MVRV has corresponded to "equilibrium" phases periods where supply is profitable but not stretched, and where the market has tended to grind higher rather than blow off or capitulate.

Realized price as structural support. The realized price essentially the market's aggregate on-chain cost basis sits around $52,750, implying an MVRV of roughly 1.21 at that level. This matters more than any resistance line drawn on a candlestick chart. A daily close below it would put a large share of holders underwater for the first time this cycle and has historically opened the door to sharper, faster corrections. On the upside, the $57,730–$67,000 band has functioned as the active trading range through late July and early August; a confirmed close above $67,000 backed by ETF inflows and a softer dollar is the level bulls need to reclaim before talking about new highs.
Derivatives positioning. Open interest is running near $22–25 billion, down slightly from its July 21 peak of roughly $23.1 billion rather than climbing further into it, and funding rates across major exchanges remain only mildly positive low single-digit basis points, with a brief spike to 0.88% in late July. In plain terms, leverage in the system hasn't reached the crowded, one-sided positioning that typically precedes a violent unwind. That's a meaningfully different setup than the funding-rate-spiking conditions that preceded past blow-off tops, and it's arguably the most reassuring on-chain data point right now: the market can absorb a shock without a cascading liquidation event being the base case.
Put together, the on-chain picture argues against both extremes in the current debate. It doesn't support the "Bitcoin is broken" thesis that a death cross alone might suggest, and it doesn't support a euphoric "supercycle" narrative either. It describes a market resetting toward its cost basis in an orderly way which is a very different risk profile than a market getting flushed out from over-leveraged, euphoric positioning.
How Fed Interest Rate Policy Is Shaping Bitcoin's 2026
The Fed held its policy rate at 3.50%–3.75% at the July meeting, and the vote wasn't unanimous three members pushed for a 25 basis point hike, a hawkish signal that the committee is far from settled on the "cuts are coming" narrative markets have priced in on and off all year. There's no scheduled FOMC meeting in August, so the next real catalyst is September 16, alongside updated economic projections.
This is the single biggest swing factor for Bitcoin right now. Core inflation running above target gives the Fed room to justify staying restrictive, and a "higher for longer" stance does two things at once: it keeps the dollar bid, and it raises the cost of parking capital in an asset that pays no yield. Bitcoin sits on the wrong side of that trade as long as it persists. The path forward really comes down to timing. An earlier-than-expected pivot to cuts would free up the kind of liquidity that has historically driven crypto's sharpest rallies. Absent that, the more likely outcome is continued range-bound chop rather than a decisive breakout.
US National Debt Levels and the Bitcoin Debasement Thesis
The structural bull case for Bitcoin rests heavily on US fiscal trajectory, and the 2026 numbers give that case plenty of ammunition. Total federal debt has pushed past $39–40 trillion, with the debt-to-GDP ratio sitting around 120%. Net interest payments have nearly tripled over five years and are projected to reach roughly $1.8 trillion annually by 2035. Zoom out further and advanced economies collectively are on track to carry a record $75.8 trillion in government debt this year, according to Fitch.
This is real and it's the core of the currency-debasement argument for holding a fixed-supply asset. But it's worth being precise about the timeframe that argument operates on. Rising debt and rising Treasury yields don't automatically translate into Bitcoin demand in the near term in fact, higher yields on government debt often pull capital toward safer instruments and away from risk assets, Bitcoin included. The debasement thesis is a multi-year structural argument, not a trading signal for the next quarter.


Geopolitical Risk: How Middle East Tensions Move Bitcoin
The ceasefire between the US/Israel and Iran has been anything but stable through 2026, breaking down and getting patched back together more than once. Each time tensions flare near the Strait of Hormuz, risk premiums across global markets reprice almost immediately. That chokepoint carries close to a fifth of the world's seaborne oil, so the transmission mechanism is direct: an escalation hits energy prices first, feeds into inflation expectations next, and ultimately narrows the Fed's room to maneuver on rates.
Bitcoin's behavior during these episodes has been inconsistent, and that inconsistency is itself the finding. Sometimes it sells off alongside equities as a risk-off asset; other times it holds up as capital looks for an exit from currency instability. Gold has a centuries-long track record of behaving predictably during geopolitical shocks. Bitcoin doesn't have that track record yet, and treating it as an automatic hedge against war risk is not supported by how it has actually traded this year.
Bitcoin Investment Opportunities to Watch in 2026
● Institutional participation is growing. Institutional investors accounted for a meaningful share of spot trading volume in the first half of 2026, a sign the market structure is maturing beyond retail-driven cycles.
● Halving cycle dynamics remain intact. On-chain data still reflects the influence of the last halving, and historically the middle portion of the cycle has favored medium-term upside.
● A rate-cut pivot could unlock capital. Any confirmation from the Fed that cuts are coming, whether at the September meeting or later, tends to be the kind of catalyst that reprices risk assets quickly.
● The debt-driven demand for alternative stores of value isn't going away. As long as global sovereign debt keeps climbing, the argument for scarce assets gets structurally reinforced.
Bitcoin Investment Risks in 2026
● Rate policy could stay restrictive longer than markets expect. A hawkish Fed surprise is the most direct way to pressure Bitcoin from here.
● August has historically been a weak month for BTC, and some analysts are putting the odds of a 25% drawdown from current levels in the range of 25–30%.
● A renewed escalation in the Middle East could spike energy prices, reignite inflation, and push the Fed further from cutting.
● Leveraged positioning remains a tail risk. Open interest is elevated enough that a sharp move in either direction could trigger cascading liquidations.
What Investors Should Actually Consider Before Buying Bitcoin
Anyone weighing a Bitcoin allocation in 2026 should think through a few concrete questions rather than a general risk appetite. What's the actual time horizon a multi-year store-of-value position, or a shorter-term trade on a Fed pivot? What percentage of the portfolio is this, and does that number survive a 50% drawdown without changing your financial situation? Is any of this being done on leverage, because that's where most of the real damage in crypto markets happens? And is there a plan to track the macro calendar FOMC dates, CPI releases, Hormuz-related headlines or is the position going to be held blind to the catalysts that move it?
None of this is unique to Bitcoin. It's the same discipline that applies to any volatile asset class. The difference is that Bitcoin's volatility is still high enough that skipping this exercise tends to get punished faster than it does in equities.
Bottom Line: Is Bitcoin Safe in 2026?
Bitcoin in 2026 doesn't behave like gold or Treasuries, and it isn't the reckless bet critics still make it out to be. What the on-chain data actually shows is a market sitting in the middle not stretched into euphoria, not flushed out in panic.The macro backdrop Fed policy, record sovereign debt, and unresolved geopolitical risk is doing more to determine direction than anything happening within the crypto market itself. Whether that adds up to a reasonable allocation depends entirely on an investor's time horizon, risk tolerance, and willingness to sit through volatility that traditional asset classes simply don't produce