
How to Spot Market Reversals Using the Williams Alligator Indicator
- Jul 23, 2025
- 3 min read
Author: Lorenzo Filotei
The importance of “market reversals” comes from their meaning. If one of them occurs, it may signal a potential change in the prevailing trend. Their identification might lead to a certain amount of profit for traders, but at the same time, a planned risk management will be crucial for deciding strategic positioning to avoid significant losses. Analysts have been working to find indicators that might lead to financial-weighted decisions, such as the WAI.
The Williams Alligator Indicator, created by Bill Williams, has been developed to identify changes in main trends. It is represented by three smoothed moving averages. The first of them is the “jaw”, the second one is the “teeth”, while the last one is the “lips”. Together, they represent a “crocodile’s mouth”.
How can Williams Alligator Indicator be interpreted?
Let’s dive into these three particular smoothed moving averages:
Jaw (Blue line): it is a 13-period smoothed moving average, shifted 8 bars forward. This one is considered the slowest moving average because it is based on a larger number of periods, but when it moves, it could be very powerful.
Teeth (Red line): it is an 8-period SMMA, shifted 5 bars forward. This one, as the medium-speed one, is mostly used to confirm or reject signals from the faster line.
Lips (Green line): it is a 5-period SMMA, shifted 3 bars forward. This is the quickest moving average and shows the short-term trend, given its strong reacting ability to price changes. If the Lips cross above or below the other lines, it can often represent the start of a new trend.
These lines are in a constant interaction, following the price action. If they are intertwined, it means that the alligator is “sleeping”, so the market is indecisive or ranging. When the Lips cross the lines and are then followed by them, it signifies that the alligator “wakes up” or that a potential trend is coming. The broader the distance between lines, the stronger the trend (the alligator is “eating”).

This chart shows how the Williams Alligator Indicator works. As you can see, the Lips (green line) crossed the other two lines. This showed a potential bullish reversal that was confirmed by the Teeth (red line) that crossed the Jaw too. Eventually, the three lines followed up, reaching higher highs.
There are some common mistakes that might be made during trading operations. One of them is about using this indicator alone. Indeed, this tool is defined as a lagging indicator, which means that it uses past price data to generate signals. Therefore, it should be considered a confirmation rather than a forecasting tool because signals may be delayed, negatively influencing traders’ decisions. Thus, this indicator should be combined with a leading indicator. One of them might be the RSI. In fact, this tool may be able to predict price moves because it bases its outcome on live divergences. So if the price makes a higher high while the RSI makes a lower high, it represents a bearish divergence, highlighting a potential reversal.
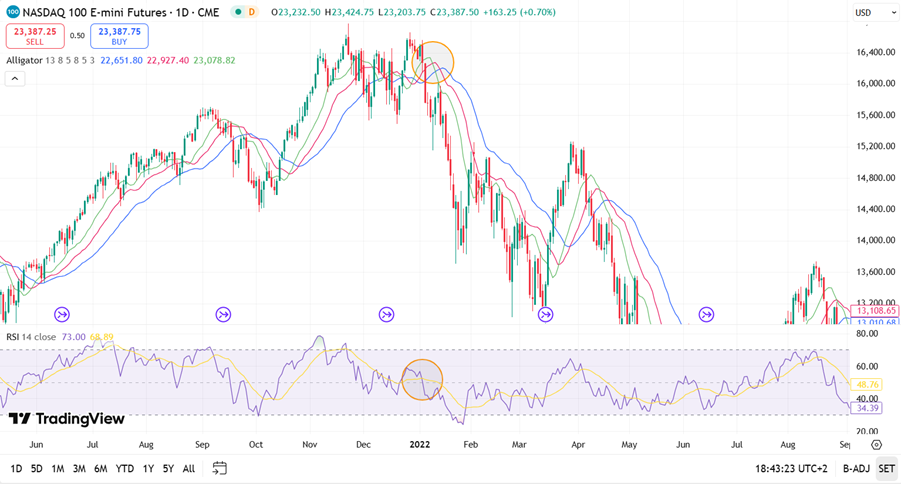
On this chart, the two aforementioned indicators are shown. The first leading signal is given by the RSI that breaks the yellow line on its chart, leading toward the beginning of a downtrend. Subsequently, the Williams Alligator Indicator has its green line (Lips) cutting first the red, then the blue line, confirming that the price will be featured by a negative slope.
Conclusions
The usage of this indicator has allowed traders to make more reliable predictions of price action. It is very famous among technical analysts that, often base their strategy on these kinds of indicators (MACD too). However, it is always necessary to have a good risk strategy to plan and manage all the opening and closing positions. Although this indicator furnishes a reliable signal, it is fundamental to utilize it combined with other indicators, perhaps leading indicators, given its delayed chart. It will be crucial for the optimization of trading strategies and short-term operations. A good strategy is crafted on the constant combination of leading and lagging indicators, because it relies on historical price data and live price action.
You can read also about:
References


Comments